The Power of Mapping to Help Foundations Leverage Impact in Age of Climate Change
Much like the old saying that all politics is local, the impacts of climate change are playing out in Southern California neighborhoods. From extended heat waves to air quality issues, climate change is affecting our most vulnerable populations (children, the elderly, the unemployed or underemployed, low income people, and communities of color); the same populations that our philanthropic community is seeking to help. That’s why I was humbled and enthusiastic to share the results of the Los Angeles Climate-Smart Cities Decision Support Tool (DST) at a recent Southern California Grantmakers gathering.
With generous support received from the MacArthur Foundation and the local funding community including Kaiser Permanente and Union Bank Foundation, the DST was generated by The Trust for Public Land in collaboration with 15 local experts, with the goal of providing a web-based, easy-to-understand mapping tool to help leaders in the public, private, nonprofit service and advocacy sectors identify and make the case for green infrastructure and urban greening. With increased green initiatives, communities can mitigate against the effects of climate change, drought, and air pollution, with particular focus on protecting those populations most vulnerable to these impacts.
In collaboration with local partners, we integrated demographic information such as income, linguistic isolation, communities of color, less than high school education, children under 5 and people over 64 years of age, unemployment, people living with asthma, and low birth weight to identify the communities most vulnerable to climate change impacts. The image below shows where these Angeleno(a) residents live with the red indicating the greatest concentration.
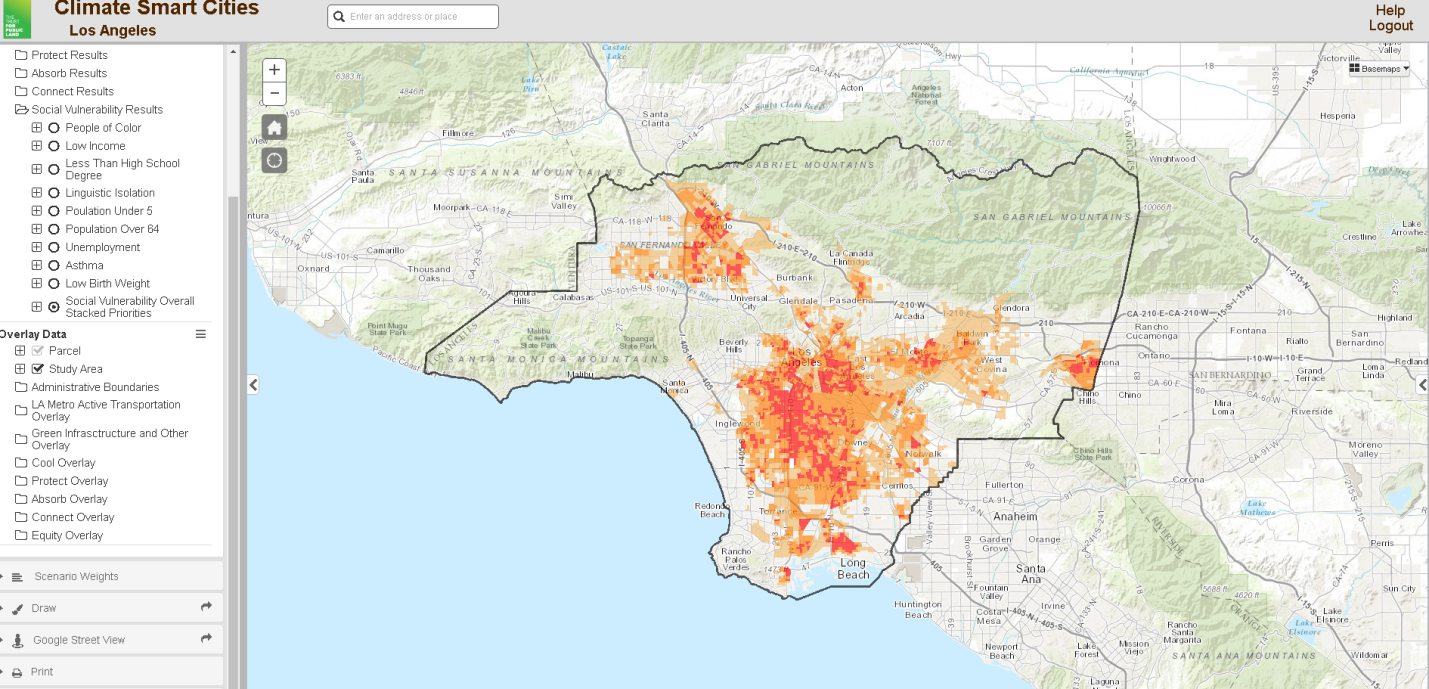
(Image 1: Geographic concentration of residents most vulnerable to climate impacts.)
Every region in the country deals with a different climate change impacts based on its topography, climate, and socioeconomics. Given Los Angeles’ (and broader Southern California’s) ongoing drought and heat wave trends, it is no surprise then that urban heat islands (a phenomena in which urban areas are 1.8-5.4 degrees hotter than rural or less built up areas), stormwater management and groundwater recharge, and socially vulnerable populations were a big concern for the local partners who helped develop the mapping tool. Additionally, local partners also wanted to identify walking, biking, and public transit linkages to connect low income communities to jobs, medical facilities, and grocery stores. Community and public health partners wanted to highlight the exposure to particular matter and ozone and people living with asthma. It has been well documented that extreme heat is one of the top natural disaster killers in the U.S. and the National Oceanic Atmospheric Administration (NOAA) has reported a string of 16 consecutive record-setting hot months, only broken this past September and October. Hotter days often lead to health issues such as heat strokes, greater air pollution, and asthma attacks or respiratory illnesses which may force parents to miss work or children from attending school; for low income communities trying to gain or keep steady jobs and improve their children’s education, heat waves may add another hurdle to overcome.
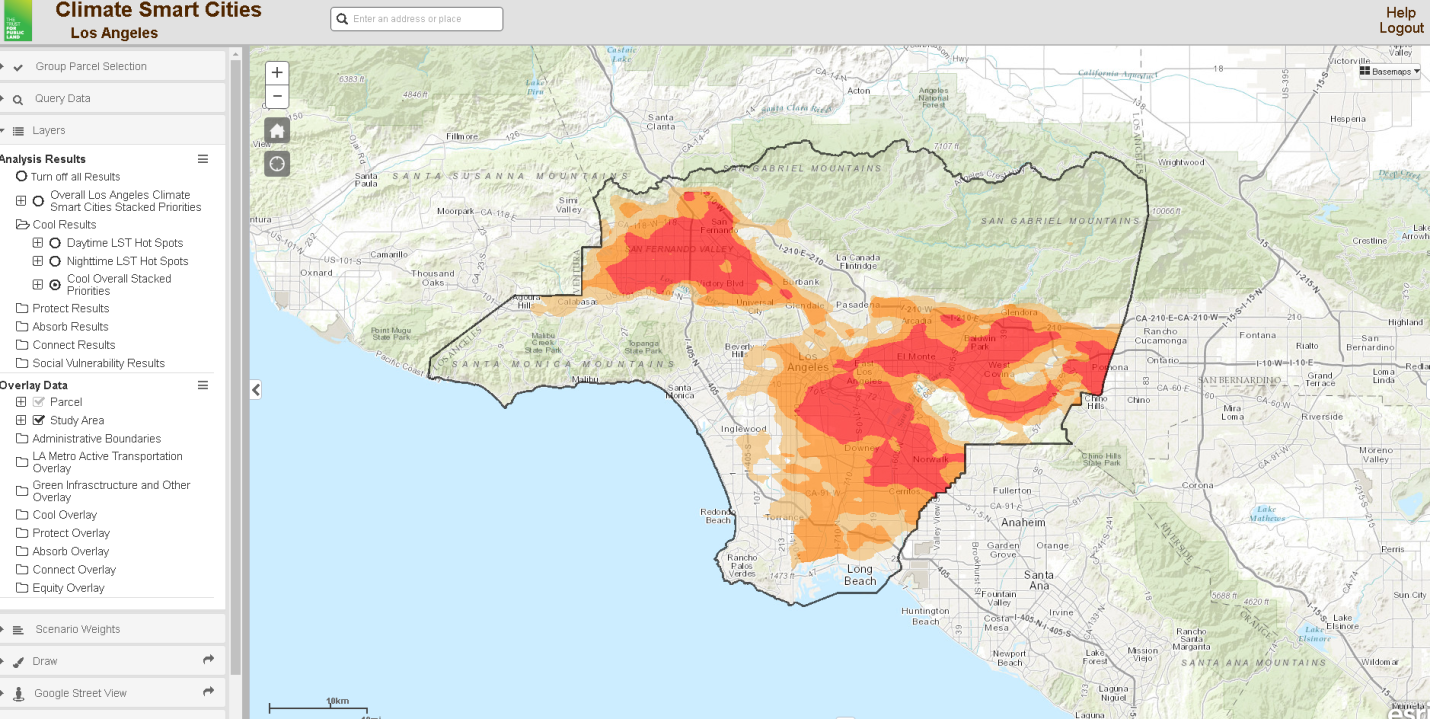
(Image 2: The image above shows the hottest areas, based on day time and night time land surface temperature readings of July and August 2015, in the LA Basin. On average, the red areas experienced temperatures ranging from 115-120 Fahrenheit while the orange areas experienced average temperatures ranging from 111-115 and the light colored areas had average temperatures of 108-111.)
The criteria embedded in the mapping tool are tagged to all of the nearly 2 million parcels within the project area which allows us to visually rank parcels by priority, based on the presence of the criteria. The goal is to help decision makers, developers, and nonprofit community advocates understand the climate impacts, community assets as well as the socioeconomic characteristics present in neighborhoods and each parcel so they will invest, or advocate for the investment of, public and private dollars to achieve multiple benefits in a climate-smart approach.
Image 3 below shows us a ranking with similar color schemes of the neighborhoods and parcels where socially vulnerable populations are most threatened by urban heat islands. It is this multiple benefit or multiple impact analysis that we hope to facilitate; the tool can also help us understand the distribution of tree canopy cover, community gardens, and park or green space.
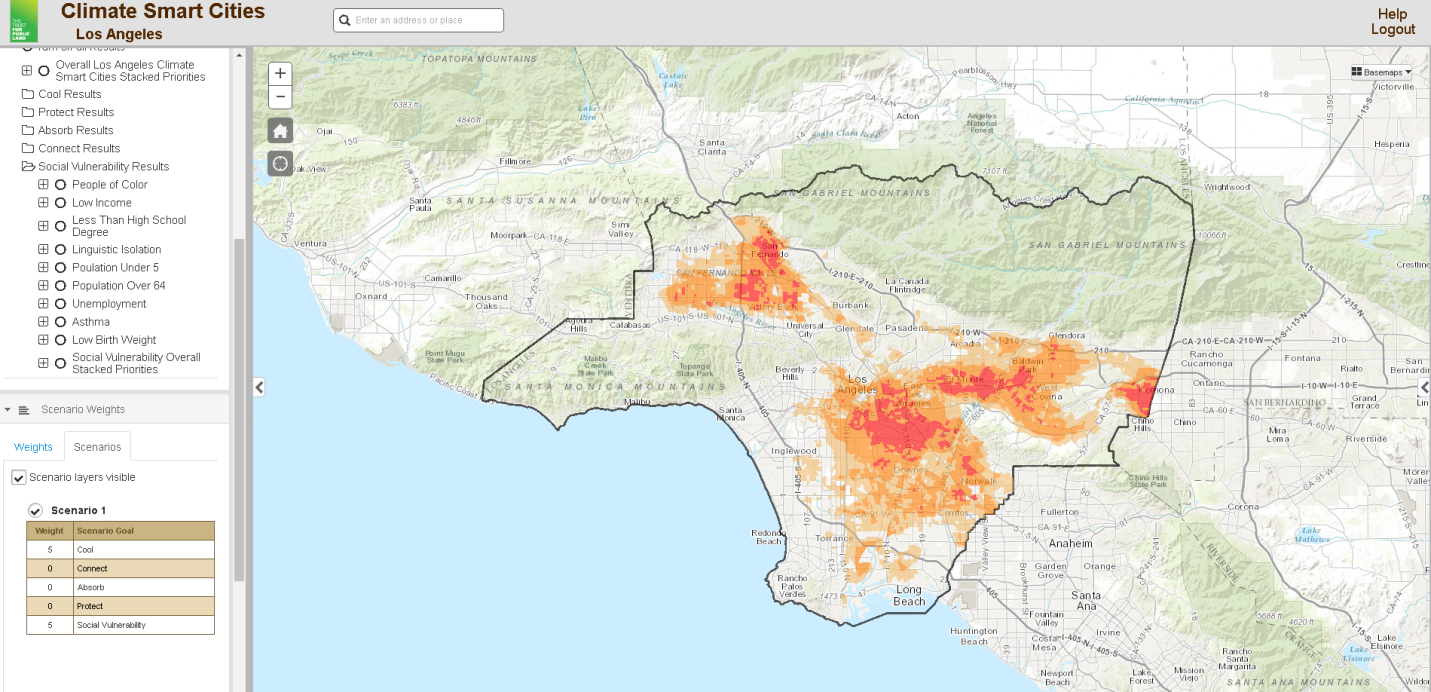
(Image 3 shows where vulnerable communities are most exposed to increased urban heat islands which result in heat strokes and worsened air quality. The red areas are those where vulnerable populations face the highest threat of urban heat islands, while the orange areas represent moderate to high threat of urban heat islands.)
As foundations invest in efforts to address the social and place-based determinants of health outcomes such as diabetes or asthma, there is an increasing awareness of the detrimental effects of climate change on the systems that support a healthy community – food systems, land use, drought and water quality, and air quality. Foundations supporting direct service delivery, place-based research, policy-development, or advocacy can use this information to understand how climate change may impact – and in the case of LA’s increasing hotter climate, exacerbate – the health or air quality challenges that their grantee communities are already experiencing. This has implications for environmental, health, and climate justice efforts in terms of how we design or redevelop disadvantaged communities. The Trust for Public Land looks forward to making this wealth of place-based and socioeconomic information freely available to municipal, nonprofit, private, philanthropic, and community leaders who are interested in understanding the intersection of climate change impacts and the socioeconomic or public health outcomes they are striving to achieve.
Categories
Content type
Strategies
Issues
About the author(s)

Related content
-
Link to Applying Human Rights Principles to Disaster Response
Applying Human Rights Principles to Disaster Response
-
Link to Calculating Your Organization’s Digital Dependence
Calculating Your Organization’s Digital Dependence
-
Link to [NEW RESOURCES] Advocacy Collaboratives
[NEW RESOURCES] Advocacy Collaboratives
-
Link to Philanthropic Strategies for Difficult Times
Philanthropic Strategies for Difficult Times
-
Link to Sticking Points: “My Foundation Is Nervous About Policy Advocacy"
Sticking Points: “My Foundation Is Nervous About Policy Advocacy"
-
Link to Matching Programs as a Way to Leverage Impact
Matching Programs as a Way to Leverage Impact
-
Link to The Green Environment Fund: Exiting a Field
The Green Environment Fund: Exiting a Field
-
Link to Why Every Funder Should Consider Participatory Grantmaking
 Why Every Funder Should Consider Participatory Grantmaking
 -
Link to Philanthropy and the Social Economy: Blueprint 2015
 Philanthropy and the Social Economy: Blueprint 2015